|
Genecopoeia
hek293t cells Hek293t Cells, supplied by Genecopoeia, used in various techniques. Bioz Stars score: 96/100, based on 1 PubMed citations. ZERO BIAS - scores, article reviews, protocol conditions and more https://www.bioz.com/product/recombinant+human+ace2+ectodomain/HEK293T+cells+stably+expressing+human+ACE2/pm30026878-121-24-32 Average 96 stars, based on 1 article reviews
hek293t cells - by Bioz Stars,
2026-09
96/100 stars
|
Buy from Supplier |
|
Sino Biological
human ace2  Human Ace2, supplied by Sino Biological, used in various techniques. Bioz Stars score: 96/100, based on 1 PubMed citations. ZERO BIAS - scores, article reviews, protocol conditions and more https://www.bioz.com/product/recombinant+human+ace2+ectodomain/Human+ACE2+%2F+Angiotensin-Converting+Enzyme+2+Gene+ORF+cDNA+clone+in+cloning+vector/pmc08186956-212-3-5 Average 96 stars, based on 1 article reviews
human ace2 - by Bioz Stars,
2026-09
96/100 stars
|
Buy from Supplier |
|
R&D Systems
mouse monoclonal alexa fluor 488 conjugated antibody Mouse Monoclonal Alexa Fluor 488 Conjugated Antibody, supplied by R&D Systems, used in various techniques. Bioz Stars score: 93/100, based on 1 PubMed citations. ZERO BIAS - scores, article reviews, protocol conditions and more https://www.bioz.com/product/recombinant+human+ace2+ectodomain/Human+ACE-2+Alexa+Fluor%C2%AE+488-conjugated+Antibody/pmc07857407-146-16-23 Average 93 stars, based on 1 article reviews
mouse monoclonal alexa fluor 488 conjugated antibody - by Bioz Stars,
2026-09
93/100 stars
|
Buy from Supplier |
|
R&D Systems
polyclonal goat anti ace2 Polyclonal Goat Anti Ace2, supplied by R&D Systems, used in various techniques. Bioz Stars score: 99/100, based on 1 PubMed citations. ZERO BIAS - scores, article reviews, protocol conditions and more https://www.bioz.com/product/recombinant+human+ace2+ectodomain/Human%2FMouse%2FRat%2FHamster+ACE-2+Antibody/pmc07524645-214-0-3 Average 99 stars, based on 1 article reviews
polyclonal goat anti ace2 - by Bioz Stars,
2026-09
99/100 stars
|
Buy from Supplier |
|
Revvity
anti human ace2  Anti Human Ace2, supplied by Revvity, used in various techniques. Bioz Stars score: 91/100, based on 1 PubMed citations. ZERO BIAS - scores, article reviews, protocol conditions and more https://www.bioz.com/product/recombinant+human+ace2+ectodomain/Anti-Human+IgG+(Goat)%2C+HRP-Labeled%2C+at/pmc08858708-59-0-11 Average 91 stars, based on 1 article reviews
anti human ace2 - by Bioz Stars,
2026-09
91/100 stars
|
Buy from Supplier |
|
Gilead Sciences
ace2 expression  Ace2 Expression, supplied by Gilead Sciences, used in various techniques. Bioz Stars score: 99/100, based on 1 PubMed citations. ZERO BIAS - scores, article reviews, protocol conditions and more https://www.bioz.com/product/recombinant+human+ace2+ectodomain/VEKLURY/pmc07679035-90-9-16 Average 99 stars, based on 1 article reviews
ace2 expression - by Bioz Stars,
2026-09
99/100 stars
|
Buy from Supplier |
|
Sino Biological
ace2 protein  Ace2 Protein, supplied by Sino Biological, used in various techniques. Bioz Stars score: 96/100, based on 1 PubMed citations. ZERO BIAS - scores, article reviews, protocol conditions and more https://www.bioz.com/product/recombinant+human+ace2+ectodomain/Human+ACE2+%2F+Angiotensin-Converting+Enzyme+2+Protein/pmc07494283-49-0-4 Average 96 stars, based on 1 article reviews
ace2 protein - by Bioz Stars,
2026-09
96/100 stars
|
Buy from Supplier |
|
Sino Biological
hek cells lines  Hek Cells Lines, supplied by Sino Biological, used in various techniques. Bioz Stars score: 96/100, based on 1 PubMed citations. ZERO BIAS - scores, article reviews, protocol conditions and more https://www.bioz.com/product/recombinant+human+ace2+ectodomain/Human+ACE2+%2F+Angiotensin-Converting+Enzyme+2+Protein+(His+Tag)%2C+Biotinylated/pmc08601568-196-45-49 Average 96 stars, based on 1 article reviews
hek cells lines - by Bioz Stars,
2026-09
96/100 stars
|
Buy from Supplier |
|
Genecopoeia
human ace2  Human Ace2, supplied by Genecopoeia, used in various techniques. Bioz Stars score: 94/100, based on 1 PubMed citations. ZERO BIAS - scores, article reviews, protocol conditions and more https://www.bioz.com/product/recombinant+human+ace2+ectodomain/Promoter+reporter+clone+for+Human+ACE2/bio_rxiv__2024__09__05__611469-150-17-19 Average 94 stars, based on 1 article reviews
human ace2 - by Bioz Stars,
2026-09
94/100 stars
|
Buy from Supplier |
|
Sino Biological
human ace2 ectodomain Human Ace2 Ectodomain, supplied by Sino Biological, used in various techniques. Bioz Stars score: 96/100, based on 1 PubMed citations. ZERO BIAS - scores, article reviews, protocol conditions and more https://www.bioz.com/product/recombinant+human+ace2+ectodomain/Human+ACE2+%2F+Angiotensin-Converting+Enzyme+2+Protein/pm34874124-44-17-24 Average 96 stars, based on 1 article reviews
human ace2 ectodomain - by Bioz Stars,
2026-09
96/100 stars
|
Buy from Supplier |
|
BPS Bioscience
sars cov 2 spike ace2 inhibitor screening assay kit  Sars Cov 2 Spike Ace2 Inhibitor Screening Assay Kit, supplied by BPS Bioscience, used in various techniques. Bioz Stars score: 93/100, based on 1 PubMed citations. ZERO BIAS - scores, article reviews, protocol conditions and more https://www.bioz.com/product/recombinant+human+ace2+ectodomain/ACE2%3A+Spike+S1-Biotin+(SARS-CoV-2+)+Inhibitor+Screening+Assay+Kit/pmc09604257-104-1-17 Average 93 stars, based on 1 article reviews
sars cov 2 spike ace2 inhibitor screening assay kit - by Bioz Stars,
2026-09
93/100 stars
|
Buy from Supplier |
Image Search Results
Journal: iScience
Article Title: A novel mouse AAV6 hACE2 transduction model of wild-type SARS-CoV-2 infection studied using synDNA immunogens
doi: 10.1016/j.isci.2021.102699
Figure Lengend Snippet: Characterization of an AAV6.2FF-hACE2 transduction model for SARS-CoV-2 infection of wild-type mice (A) Diagram of AAV genome expressing hACE2 from the CASI promoter. (B) Western blot of HEK293 cells transduced with AAV6.2FF-hACE and probed with an anti-hACE2 antibody. (C) BALB/c mice were administered 1 x 10 11 vg of AAV-Luc intranasally and imaged 10 days later using an IVIS imager. (D–F) (D) IFA images of lungs harvested from BALB/c mice infected intranasally with 1 x 10 11 vg of AAV-hACE2 or AAV-Luc and euthanized 10 days later. Lungs were stained with a rabbit anit-hACE2 antibody and imaged at 20 X (scale bar, 50mM). Viral RNA (E), and virus TCID50 titers (F) were determined in respiratory tissues on days 2 and 4 post-infection. n = 6 (3M, 3F). Statistical significance determined by Mann-Whitney test. ∗ = p < 0.05, ∗∗ = p < 0.01.
Article Snippet: The cDNA for
Techniques: Transduction, Infection, Expressing, Western Blot, Staining, MANN-WHITNEY

Journal: iScience
Article Title: A novel mouse AAV6 hACE2 transduction model of wild-type SARS-CoV-2 infection studied using synDNA immunogens
doi: 10.1016/j.isci.2021.102699
Figure Lengend Snippet: SARS-CoV-2 spike DNA antigens protect from viral replication in vivo (A) Mice were immunized once or twice separated by four weeks with 10ug of pS via electroporation. Serum was collected at day 18 post-final immunization. At 35 days post-final immunization mice were infected intranasally with adeno-associated virus expressing human ACE2 (white). 17 days following AAV6-ACE2 transduction, animals were intranasally infected with 1 × 10 5 PFU of SARS-CoV-2 VIDO-01 P2. Four days post infection, animals were sacrificed to quantify viral replication. SARS-CoV-2 specific serum IgG endpoint titers (B) and pseudoviral neutralization titers (C) at day 18 post-final immunization. Replication competent virus (D), and viral RNA (E) in the lungs four-days post-infection. Pearson correlations between virus titer and serum IgG endpoints (F) and neutralization titers (G). Pearson correlations between viral RNA copies and serum IgG endpoints (H) and neutralization titers (I). Each point represents the average of duplicate samples from an individual animal, bars represent the mean, lines represent the median, and error bars represent the SD. ∗p < 0.05, ∗∗p < 0.01, ∗∗∗∗p < 0.0001 by student's t-test (A and B), or Kruskall-Wallis ANOVA (D and E). Spearman correlations were used to determine relationships (F-I). Data are representative of one experiment with n = 5 males (squares) and 5 females (circles) per group.
Article Snippet: The cDNA for
Techniques: In Vivo, Electroporation, Infection, Expressing, Transduction, Neutralization

Journal: iScience
Article Title: A novel mouse AAV6 hACE2 transduction model of wild-type SARS-CoV-2 infection studied using synDNA immunogens
doi: 10.1016/j.isci.2021.102699
Figure Lengend Snippet:
Article Snippet: The cDNA for
Techniques: Recombinant, Plasmid Preparation, Enzyme-linked Immunospot, Software
Journal: Cell Reports
Article Title: Limited extent and consequences of pancreatic SARS-CoV-2 infection
doi: 10.1016/j.celrep.2022.110508
Figure Lengend Snippet: Stringent ACE2 requirement for pancreatic islet cell infection with SARS-CoV-2 (A) Representative contour plots gated on live α, β, and “other” cells pre-treated with IgG (irrelevant polyclonal goat antibody AF7197) or the anti-ACE2 blocking antibody AF933 prior to SARS-CoV-2 infection (48 h). (B) Summary of SARS-CoV-2 NP expression by live islet cell subsets as a function of IgG treatment or ACE2 blockade (n = 6 donors). (C) Percent infection inhibition for β and “other” cells (inhibition for α cells is not shown because the very low extent of α cell infection in IgG-treated cultures for 2 of 6 donors substantially skews such calculations). (D) Infectious SARS-CoV-2 titers and extent of infection inhibition following ACE2 blockade (n = 3 donors). (E) Quantification of chemokines and cytokines in UV-inactivated TCS of SARS-CoV-2-infected islet cell cultures under conditions of IgG treatment or ACE2 blockade (48-h infection, n = 3 donors). (F) Infectious SARS-CoV-2 titers in TCS as a function of glucose concentration in islet culture medium (n = 3 donors). (G) Quantification of CXCL10 and CXCL11 in TCS as a function of glucose concentration. All summary bar diagrams represent mean ± SD and scatter for the indicated number of donors; statistical analyses were conducted by paired t test or repeated-measures ANOVA with Tukey’s multiple comparisons where applicable (∗, p < 0.05; ∗∗, p < 0.01; ∗∗∗, p < 0.001). All summary bar diagrams represent mean ± SD and scatter for the indicated number of donors; statistical analyses were conducted by paired t test or repeated-measures ANOVA with Tukey’s multiple comparisons where applicable.
Article Snippet:
Techniques: Infection, Blocking Assay, Expressing, Inhibition, Concentration Assay

Journal: Cell Reports
Article Title: Limited extent and consequences of pancreatic SARS-CoV-2 infection
doi: 10.1016/j.celrep.2022.110508
Figure Lengend Snippet:
Article Snippet:
Techniques: Conjugation Assay, Purification, Blocking Assay, Recombinant, Control, Virus, Saline, Modification, Staining, Library Quantification, Antibody Labeling, Flow Cytometry, Software, Cytometry, Sequencing
Journal: Oncotarget
Article Title: MEK inhibitors reduce cellular expression of ACE2, pERK, pRb while stimulating NK-mediated cytotoxicity and attenuating inflammatory cytokines relevant to SARS-CoV-2 infection
doi: 10.18632/oncotarget.27799
Figure Lengend Snippet: The effects of chloroquine, hydroxychloroquine, remdesivir and MEK inhibitors (VS-6766, selumetinib and trametinib) on ACE2, TMPRSS2 and IL-6 in human lung and colon cells are shown. ( A ) H1975 human NSCLC cells were treated with the indicated drugs and doses for 48 hours. Glycosylated ACE2, ACE2, TMPRSS2 (full-length and Serine Protease-domain), IL-6 were probed with the cell signaling 4355, Abnova PAB13444, Sigma MABF2158, and Sigma SAB1408591 antibodies. β-Actin was probed with Sigma A5441 as a loading control. ( B ) Effect of remdesivir and VS-6766 on ACE2(-1119)-Luc reporter and cell viability (bioluminescence images are shown in the grids on the left). HCT116 human colorectal cancer cells were transiently transfected with ACE2(-1119)-Luc reporter for 24 hours followed by remdesivir and VS-6766 treatment for 24 hours at the indicated doses. First D-Luciferin was added to acquire ACE2-Luc reporter bioluminescence images (left panel) with the Xenogen IVIS system. After the bioluminescence signal decayed, CellTiter-Glo was added to acquire cell viability images (right panel; “CTG”) with the IVIS system. The right bar graph shows ACE2 mRNA level in HCT116 cells treated with remdesivir and VS-6766 for 24 hours. mRNA levels were quantified by qRT-PCR. Data were normalized to GAPDH expression and plotted relative to cells treated with DMSO as a control. Data are expressed as mean ± SD. ( C ) Remdesivir alone increased ACE2 protein expression. H1299 human NSCLC cells, MSTO-211H human mesothelioma cells, and Calu-3 human NSCLC type II alveolar cells were treated with remdesivir and VS-6766 for 48 hours. ACE2 was probed with Abnova PAB13444 antibody, and β-Actin was probed with Sigma A5441 antibody as a loading control.
Article Snippet: To further investigate the correlation between MAPK-pERK activation and
Techniques: Transfection, Quantitative RT-PCR, Expressing

Journal: Oncotarget
Article Title: MEK inhibitors reduce cellular expression of ACE2, pERK, pRb while stimulating NK-mediated cytotoxicity and attenuating inflammatory cytokines relevant to SARS-CoV-2 infection
doi: 10.18632/oncotarget.27799
Figure Lengend Snippet: ( A ) Calu-3 human NSCLC type II alveolar cells were pretreated with 10 μM MEK inhibitor (VS-6766, trametinib or selumetinib) for 1 hr before incubation with 4.7 μM recombinant SARS-CoV-2 spike protein subunit 1 (S1, 0.118 μg/mL) or subunit 2 (S2, 0.275 μg/mL) for 2 hr. ACE2 protein detected with sc-390851 was increased following cell incubation with S1 and S2. All three MEK inhibitors suppressed increased ACE2. ( B ) HT-29 human colorectal cancer cells and BEAS-2B normal human bronchial epithelial cells were pretreated with 10 μM RAF/MEK inhibitor VS-6766 for 1 hr before incubation with 4.7 μM recombinant SARS-CoV-2 spike protein subunit 1 (S1, 0.118 μg/mL) and subunit 2 (S2, 0.275 μg/mL) for 2 hr. Recombinant SARS-CoV-2 spike protein subunits increased pERK expression which was completely abrogated by VS-6766 treatment.
Article Snippet: To further investigate the correlation between MAPK-pERK activation and
Techniques: Incubation, Recombinant, Expressing

Journal: Oncotarget
Article Title: MEK inhibitors reduce cellular expression of ACE2, pERK, pRb while stimulating NK-mediated cytotoxicity and attenuating inflammatory cytokines relevant to SARS-CoV-2 infection
doi: 10.18632/oncotarget.27799
Figure Lengend Snippet: ( A ) Effects of 5 μM remdesivir (RDV), RAF/MEK inhibitor VS-6766, or the combination on ACE2, ERK1/2, and pERK protein expression. HCT116 human colorectal cancer cells, H1975 human NSCLC cells and BEAS-2B normal human bronchial epithelial cells were treated with 5 μM VS-6766 or/and 5 μM Remdesivir for 48 hr. Remdesivir alone increased pERK protein expression in all three cell lines, which was completely depleted by VS-6766 treatment. Effects of 5 μM RDV, VS-6766, or the combination on ACE2, ERK1/2, and pERK protein expression in ( B ) normal human lung cells and ( C – E ) human lung cancer cells are shown. Serum-deprived cells were plated and cultured in medium containing 1% FBS for the indicated amount of time. For serum-stimulated cells, FBS was added to a final concentration of 10% for 24 hours (B–E, left 2 panels). Cells were plated in 10% serum for 16 hours, then media was removed and replaced with 1% FBS for serum-deprived cells. For serum-stimulated cells, FBS was added to a final concentration of 10% for 4 hours (E, right panel). ACE2 (PAB), ACE2 (CS), ERK1/2, and pERK were probed with Abnova PAB13444, Cell Signaling 4355, Cell Signaling 9102, and Cell Signaling 4370 antibodies. Ran was probed with BD Biosciences 610341 antibody as a loading control. ( F ) Modulation of pRb and ACE2 expression in H1299 cells with serum starvation, stimulation, and MEKi treatment. Control cells were grown with the normal 10% serum throughout the treatment. Serum starved cells were plated in 10% serum and incubated for 16 hours, then grown in media containing 0% serum for 72 hours. Serum stimulated cells were similarly starved for 72 hours, then stimulated with media containing 20% serum for 48 hours. All drug treated cells received 5 mM RDV, VS-6766, or the combination 48 hours before harvesting. ( G ) Modulation of ACE2 expression with serum starvation and stimulation. Four different cell lines (2 lung, 1 colorectal, and 1 breast cancer) were grown in 10% serum for 16 hours then were starved in 0% FBS for 0 (no starvation), 24, 48, or 72 hours. Cells were stimulated with 20% FBS and harvested either 0 (no stimulation), 12, or 24 hours later. An increase in pRb relative to total Rb was seen upon stimulation and this correlated with ACE2 levels. pERK correlation with ACE2 was heterogeneous, with a correlation seen in MCF7 cells but not H1299 or HCT-116 cells (three left-most panels). pRb relative to total Rb decreased upon starvation and increased upon stimulation, which correlated with ACE2 expression (H460 and HCT-116 in right-most panels).
Article Snippet: To further investigate the correlation between MAPK-pERK activation and
Techniques: Expressing, Cell Culture, Concentration Assay, Incubation
Journal: Cell
Article Title: Mapping Neutralizing and Immunodominant Sites on the SARS-CoV-2 Spike Receptor-Binding Domain by Structure-Guided High-Resolution Serology
doi: 10.1016/j.cell.2020.09.037
Figure Lengend Snippet: Kinetics of IgG Responses Specific for the SARS-CoV-2 RBD and Blocking RBD Attachment to ACE2 (A) Binding titers (ED50) of serum or plasma IgG to the SARS-CoV-2 RBD measured at two time points separated by an average time of 44 days in 368 subjects. T1, time of first blood draw; T2, time of second blood draw. (B) Variation of RBD-specific IgG binding titers from T1 to T2. (C) Kinetics of RBD- and N-specific IgG responses in serum or plasma from 24 convalescent individuals (red, hospitalized; blue, symptomatic non-hospitalized). The starting time point corresponds to the date of collection of the first sample. (D) Model predicted longitudinal decline of RBD- and N-specific IgG binding titers from 18 convalescent individuals with respect to the onset of symptoms from infection. Symbols, observations; shaded region, 90% prediction interval; line, median prediction. (E) Serum or plasma titers of Abs blocking RBD attachment to ACE2 (BD80) measured at T1 and T2. (F) Variation of RBD-specific IgG binding titers and titers of Abs blocking RBD attachment to ACE2 (BD80) from T1 to T2. (G) Avidity index of serum IgG binding to RBD (%) measured at T1 and T2. (H) Variation of avidity index of IgG binding to RBD (%) from T1 to T2.
Article Snippet:
Techniques: Blocking Assay, Binding Assay, Infection

Journal: Cell
Article Title: Mapping Neutralizing and Immunodominant Sites on the SARS-CoV-2 Spike Receptor-Binding Domain by Structure-Guided High-Resolution Serology
doi: 10.1016/j.cell.2020.09.037
Figure Lengend Snippet: Analysis of the Specificity of IgG, IgA, and IgM Serum/Plasma Abs from a Panel of 647 Hospitalized, Symptomatic, and Asymptomatic SARS-CoV-2-Infected Individuals (A–C) Binding titers (ED50) of antigen-specific IgG (A), IgA (B), or IgM (C) were measured in plasma or sera from convalescent SARS-CoV-2 patients (47 hospitalized, 556 symptomatic, and 44 asymptomatic) and from pre-pandemic healthy donors (n = 32). A cut-off of 30 was determined based on signal of pre-pandemic samples and binding to uncoated ELISA plates. (D) Binding titers (ED50) of S- and N-specific IgGs measured in sera from symptomatic and asymptomatic SARS-CoV-2-infected individuals from the Ticino healthcare workers cohort (n = 459) categorized according to symptoms severity, as described in the methods. (E) IgG binding titers to SARS-CoV-2 RBD (left) and SARS-CoV-2 S pseudovirus neutralizing titers (ID80, center) before and after depletion of RBD-specific Abs from 21 SARS-CoV-2 immune plasma samples. The percentage of depletion of binding and neutralizing Abs (right) for each sample tested is shown on the right. (F) Ab-mediated inhibition of SARS-CoV-2 RBD binding to solid phase ACE2, as determined by ELISA. Shown is the reciprocal plasma or serum dilution that blocks 80% binding (BD80) of RBD to human ACE2. (G) Ab-mediated inhibition of SARS-CoV-2 RBD binding to solid phase ACE2 in the Ticino healthcare workers cohort determined as in (F). A cut-off of 10 was used to separate neutralizing from non-neutralizing titers. (H) Correlation analysis between levels of plasma/serum RBD-specific IgG (ED50) and the titers of Abs blocking RBD attachment to ACE2 (BD80). (I) Correlation analysis between plasma/serum neutralizing Ab titers (ID80) and the titers of Abs blocking RBD attachment to ACE2 (BD80).
Article Snippet:
Techniques: Infection, Binding Assay, Enzyme-linked Immunosorbent Assay, Inhibition, Blocking Assay

Journal: Cell
Article Title: Mapping Neutralizing and Immunodominant Sites on the SARS-CoV-2 Spike Receptor-Binding Domain by Structure-Guided High-Resolution Serology
doi: 10.1016/j.cell.2020.09.037
Figure Lengend Snippet: Characteristics of the Six Probe mAbs Used for Structural and Epitope-Mapping Studies, Related to , , , , and (A) V(D)J usage, percentage identity to germline, number of somatic mutations, source and time interval between sample collection and mAb isolation, RBD site recognized and neutralization potency of the 6 mAbs. B mem, memory B cell; PC, plasma cells. (B) Binding of the 6 mAbs to the SARS-CoV-2 (up) or SARS-CoV (down) RBD analyzed by ELISA. (C) Competition matrix for binding of each of the six mAbs in presence of another mAb evaluated by biolayer interferometry. (D) mAb-mediated inhibition of RBD binding to ACE2 analyzed by ELISA. (E) mAb-mediated S 1 subunit shedding from cell-surface expressed SARS-CoV-2 S as determined by flow-cytometry. (F) Conservation of RBM and epitope residues in ∼74,000 SARS-CoV-2 sequences (GISAID, August 11 th , 2020). RBM and epitope residues are shown as gray bars. Black bars indicate variant prevalence for epitope residues with at least 2 variants. RBM residues were determined from PDB 6M0J using a 5.0 Å distance cutoff between RBD and ACE2 residues using MOE. (G) Western-blot analysis (top) of the prefusion-stabilized SARS-CoV-2 S ectodomain trimer in presence of S2A4, S304 or S2X35 Fab after incubation for the indicated amount of times. Red ponceau staining (bottom) of the SDS-PAGE gel used for carrying out the western blot confirming the presence of added Fabs when indicated. (H) Analysis of activation of FcγRIIIa (V158 allele) expressed on Jurkat cells by SARS-CoV-2 S stably transfected CHO cells incubated with mAbs. GRLR indicates an antibody Fc variant carrying mutations that abolish binding to FcγRs. (I) Analysis of activation of FcγRIIa (H131 allele), expressed on Jurkat cells by SARS-CoV-2 S stably transfected CHO cells incubated with mAbs. (J) Killing of SARS-CoV-2 S stably transfected CHO cells by mAbs in the presence of complement (CDC assay).
Article Snippet:
Techniques: Isolation, Neutralization, Binding Assay, Enzyme-linked Immunosorbent Assay, Inhibition, Flow Cytometry, Variant Assay, Western Blot, Incubation, Staining, SDS Page, Activation Assay, Stable Transfection, Transfection, CDC Assay

Journal: Cell
Article Title: Mapping Neutralizing and Immunodominant Sites on the SARS-CoV-2 Spike Receptor-Binding Domain by Structure-Guided High-Resolution Serology
doi: 10.1016/j.cell.2020.09.037
Figure Lengend Snippet: The S2H13 mAb Inhibits SARS-CoV-2 by Blocking Attachment to ACE2 via Recognition of an Epitope Accessible in the Open and Closed S Conformations (A) SARS-CoV-2 S pseudovirus neutralization assay indicating an IC50 of 500 ng/mL. (B and C) Molecular surface representation of the SARS-CoV-2 S/S2H13 Fab complex structure with three RBDs closed shown in two orthogonal orientations. (D) Molecular surface representation of the SARS-CoV-2 S/S2H13 Fab complex structure with one RBD open. Each SARS-CoV-2 protomer is colored distinctly (cyan, pink, and gold), and N-linked glycans are rendered as dark blue surfaces. The S2H13 light and heavy chain variable domains are colored magenta and purple, respectively. (E) S2H13 recognizes a crevice formed by the SARS-CoV-2 RBM. Selected side chains at the interface are shown. (F) S2H13 and ACE2 (dark green) bind overlapping RBM epitope. The red star indicates steric clashes. (G) BLI binding competition between S2H13 and ACE2 for binding to the SARS-CoV-2 RBD. (H) Molecular surface representation of the SARS-CoV-2 RBD (gray) with the S2H13 epitope colored by residue conservation across SARS-CoV-2 isolates and SARS-CoV.
Article Snippet:
Techniques: Blocking Assay, Neutralization, Binding Assay

Journal: Cell
Article Title: Mapping Neutralizing and Immunodominant Sites on the SARS-CoV-2 Spike Receptor-Binding Domain by Structure-Guided High-Resolution Serology
doi: 10.1016/j.cell.2020.09.037
Figure Lengend Snippet: The S2H14 mAb Inhibits SARS-CoV-2 by Blocking Attachment to the ACE2 Receptor (A) SARS-CoV-2 S pseudovirus neutralization assay indicating an IC50 of 900 ng/mL. (B and C) Molecular surface representation of the SARS-CoV-2 S/S2H14 Fab complex structure with two RBDs open and one RBD closed viewed along two orthogonal orientations. (D and E) Molecular surface representation of the SARS-CoV-2 S/S2H14 Fab complex structure with three RBDs open shown in two orthogonal orientations. Each SARS-CoV-2 protomer is colored distinctly (cyan, pink, and gold), and N-linked glycans are rendered as dark blue surfaces. The S2H14 light and heavy chain variable domains are colored magenta and purple, respectively. (F) S2H14 binds to an epitope within the SARS-CoV-2 RBM. (G) S2H14 and ACE2 (dark green) bind overlapping RBM epitope. The red star indicates steric clashes. (H) BLI binding competition between S2H14 and ACE2 for binding to the SARS-CoV-2 RBD. (I) Molecular surface representation of the SARS-CoV-2 RBD (gray) with the S2H14 epitope colored by residue conservation across SARS-CoV-2 isolates and SARS-CoV.
Article Snippet:
Techniques: Blocking Assay, Neutralization, Binding Assay

Journal: Cell
Article Title: Mapping Neutralizing and Immunodominant Sites on the SARS-CoV-2 Spike Receptor-Binding Domain by Structure-Guided High-Resolution Serology
doi: 10.1016/j.cell.2020.09.037
Figure Lengend Snippet: The S2A4 mAb Promotes SARS-CoV-2 S Opening through Binding to a Cryptic Epitope (A) SARS-CoV-2 S pseudovirus neutralization assay indicating an IC50 of 3.5 μg/mL. (B and C) Molecular surface representation of the SARS-CoV-2 S/S2A4 Fab complex cryo-EM structure with three RBDs open viewed along two orthogonal orientations. Each SARS-CoV-2 protomer is colored distinctly (cyan, pink, and gold), and N-linked glycans are rendered as dark blue surfaces. The S2A4 light and heavy chains are colored magenta and purple, respectively. (D and E) Zoomed-in views of the contacts formed between S2A4 and the RBD with selected side chains shown. (F) S2A4 and ACE2 (dark green) bind distinct RBD epitopes but would clash via steric hindrance. The red star indicates steric clashes. (G) BLI binding competition between S2A4 and ACE2 for binding to the SARS-CoV-2 RBD. (H) Molecular surface representation of the SARS-CoV-2 RBD (gray) with the S2A4 epitope colored by amino acid residue conservation with SARS-CoV. The position of the SARS-CoV N357 glycan is indicated with red dotted lines.
Article Snippet:
Techniques: Binding Assay, Neutralization, Cryo-EM Sample Prep

Journal: Cell
Article Title: Mapping Neutralizing and Immunodominant Sites on the SARS-CoV-2 Spike Receptor-Binding Domain by Structure-Guided High-Resolution Serology
doi: 10.1016/j.cell.2020.09.037
Figure Lengend Snippet: The S304 mAb Promotes SARS-CoV-2 S Opening through Binding to a Cryptic Epitope Conserved within the Sarbecovirus Subgenus (A and B) Molecular surface representation of the SARS-CoV-2 S/S304 Fab complex cryo-EM structure with three RBDs opened viewed along two orthogonal orientations. Each SARS-CoV-2 S protomer is colored distinctly (cyan, pink, and gold), and N-linked glycans are rendered as dark blue surfaces. The S304 light and heavy chains are colored magenta and purple, respectively. (C) Cryo-EM reconstruction of the S 1 subunit trimer (with disordered S 2 ) bound to three S304 Fabs viewed along two orthogonal orientations and the corresponding atomic model fit in density. Each SARS-CoV-2 S 1 protomer is colored distinctly (cyan, pink, and gold). The S304 light and heavy chains are colored magenta and purple, respectively. (D) Ribbon diagram of the crystal structure of S304 (pink and purple), S2H14, and S309 in complex with the SARS-CoV-2 RBD (light blue). Only the S304 variable domains are shown, whereas S2H14 and S309 were omitted for clarity. (E) Positioning of ACE2 (dark green) relative to the S304 Fab bound to the SARS-CoV-2 RBD. ACE2 N-linked glycans at position N322 and N546 are indicated, as they could putatively clash with S304. (F) Molecular surface representation of the SARS-CoV-2 RBD (gray) with the S304 epitope colored by residue conservation with SARS-CoV. (G and H) Positioning of ACE2 (dark green) relative to the S2A4 (G) and S2X35 (H) Fabs bound to the SARS-CoV-2 RBD. The red stars indicate steric clashes.
Article Snippet:
Techniques: Binding Assay, Cryo-EM Sample Prep

Journal: Cell
Article Title: Mapping Neutralizing and Immunodominant Sites on the SARS-CoV-2 Spike Receptor-Binding Domain by Structure-Guided High-Resolution Serology
doi: 10.1016/j.cell.2020.09.037
Figure Lengend Snippet: Structure-Guided High-Resolution Serology (A) Composite model of the SARS-CoV-2 S trimer with three open RBDs viewed along two orientations with all six mAbs used for competition ELISA shown bound to one RBD. (B–G) Epitopes recognized by each mAb are shown on the surface of the RBD for S2H14 (teal, B), S2H13 (orange, C), S2X35 (red, D), S2A4 (yellow, E), S304 (magenta, F), and S309 (purple, G). The glycan at position N343 is rendered as blue spheres and the RBM is shown as a black outline. (H–J) Competition ELISA (blockade-of-binding) between individual mAbs and sera or plasma from hospitalized (H), symptomatic (I), and asymptomatic (J) COVID-19 convalescent subjects. Each plot shows the magnitude of inhibition of binding to immobilized RBD in the presence of each mAb, expressed as reciprocal sera or plasma dilution blocking 80% of the maximum binding response. (K) Correlation analysis of titers of serum Abs blocking RBD binding to ACE2 and Abs blocking each of the six probe mAbs. (L) Comparison of RBD-specific IgG titers between sera containing Ab blocking at least one probe mAb and sera that do not contain Ab blocking any of the six probe mAbs.
Article Snippet:
Techniques: Enzyme-linked Immunosorbent Assay, Binding Assay, Inhibition, Blocking Assay

Journal: Cell
Article Title: Mapping Neutralizing and Immunodominant Sites on the SARS-CoV-2 Spike Receptor-Binding Domain by Structure-Guided High-Resolution Serology
doi: 10.1016/j.cell.2020.09.037
Figure Lengend Snippet:
Article Snippet:
Techniques: Infection, Recombinant, Blocking Assay, Stable Transfection, Expressing, Magnetic Beads, Protein Binding, Luciferase, Transfection, Plasmid Preparation, Software, Spectrophotometry
Journal: PLoS ONE
Article Title: Recombinant production of a functional SARS-CoV-2 spike receptor binding domain in the green algae Chlamydomonas reinhardtii
doi: 10.1371/journal.pone.0257089
Figure Lengend Snippet: (A) HEK-cell produced RBD fragment fused to Rabbit IgG Fc fragment (RBD::rFc) binding to immobilized biotinylated recombinant human ACE2 was detected by anti-Rabbit IgG-HRP antibodies and TMB chromogenic reaction. Data shown represent values from one experiment. (B) ACE2 Receptor binding competition assay between a constant concentration of partially purified ER-Golgi Retained Algae-Produced RBD::mClover (~40 nM) and increasing amounts of RBD::rFc or Bovine Serum Albumin showing specific competition. RBD::mClover binding was detected using anti-GFP HRP antibodies. Data points represent mean and error bars represent Standard Error of the Mean of normalized A 490 signal values over three independent experimental repeats.
Article Snippet: Strepavidin coated microtiter plates (Cat#15124, Thermo Fisher) were washed 3X in Receptor Assay Blocking buffer (25 mM TrisHCl, 150mM NaCl, pH 7.4, 0.1% wt/vol Bovine Serum Albumin, 0.05% vol/vol Tween-20) and then were coated with 50 ng per well of biotylated human ACE2 produced in
Techniques: Produced, Binding Assay, Recombinant, Competitive Binding Assay, Concentration Assay, Purification
Journal: bioRxiv
Article Title: SARS-CoV-2 Nsp15 antagonizes the cGAS-STING-mediated antiviral innate immune responses
doi: 10.1101/2024.09.05.611469
Figure Lengend Snippet: (A) Schematic diagram of the recombinant SARS-CoV-2 genome with Nsp15 H234A and N277A mutations. (B) Replication kinetics of Nsp15 WT , Nsp15 H234A , and Nsp15 N277A rSARS-CoV-2 in Vero E6 cells (MOI of 0.001). (C) Cell lysates from mock- and virus-infected Vero E6 cells (MOI of 0.001) after 48 h of infection were incubated with anti-Nsp15 antibody or isotype control. Immunoblot analysis applied for the immunoprecipitated Nsp15 proteins. (D) Western blot for ACE2 and STAT1 in A549-ACE2 cells with or without STAT1 knockout. (E and F) Replication kinetics of Nsp15 WT , Nsp15 H234A , and Nsp15 N277A rSARS-CoV-2 in A549-ACE2 and A549-ACE2/STAT1 KO cells (MOI of 1). (G) The area under the curve (AUC) was measured from each viral growth curve and plotted as a bar graph. Data are mean ± SD (n = 3) and analyzed by two-way ANOVA with Dunnett’s multiple comparison test. (H-K) A549-ACE2 cells were uninfected or infected by Nsp15 WT , Nsp15 H234A , and Nsp15 N277A rSARS-CoV-2 at MOI of 1 for 8 and 24 h. Total RNA collected for evaluating the host responses by RT-qPCR. Relative gene expression was normalized by 18S rRNA and presented relative to mock infection. Data are mean ± SD (n = 3) and analyzed by two-way ANOVA with Dunnett’s multiple comparison test. * P ≤0.05; *** P ≤0.001; **** P ≤0.0001; ns, not significant.
Article Snippet: BHK-21-hACE2 cell, a derivative of BHK-21 cell (ATCC, CCL-10), was established by transduction of lentiviral particle bearing
Techniques: Recombinant, Virus, Infection, Incubation, Control, Western Blot, Immunoprecipitation, Knock-Out, Comparison, Quantitative RT-PCR, Gene Expression

Journal: bioRxiv
Article Title: SARS-CoV-2 Nsp15 antagonizes the cGAS-STING-mediated antiviral innate immune responses
doi: 10.1101/2024.09.05.611469
Figure Lengend Snippet: (A) Design of rVSV-EGFP genome bearing SARS-CoV-2 Nsp15. (B) Vero cells were uninfected or infected by rVSV-EGFP expressing WT and H234A Nsp15 at MOI of 0.1 for 16 h. Western blot performed to verify the expression of indicated proteins. (C and D) Replication kinetics of parental rVSV-EGFP and rVSV-EGFP expressing WT and H234A Nsp15 in A549-ACE2 and A549-ACE2/STAT1 KO cells (MOI of 0.1). Data are mean ± SD (n = 3) and analyzed by two-way ANOVA with Dunnett’s multiple comparison test. (E-H) Total RNA collected from A549-ACE2 cells with rVSV-Nsp15 WT and -Nsp15 H234A infection and mock infection. RNA level of indicated host genes relative to 18S rRNA was measured by RT-qPCR and presented by fold change over mock infection. Data are mean ± SD (n = 3) and analyzed by two-way ANOVA. * P ≤0.05; ** P ≤0.01; *** P ≤0.001.
Article Snippet: BHK-21-hACE2 cell, a derivative of BHK-21 cell (ATCC, CCL-10), was established by transduction of lentiviral particle bearing
Techniques: Infection, Expressing, Western Blot, Comparison, Quantitative RT-PCR

Journal: bioRxiv
Article Title: SARS-CoV-2 Nsp15 antagonizes the cGAS-STING-mediated antiviral innate immune responses
doi: 10.1101/2024.09.05.611469
Figure Lengend Snippet: A549-ACE2 cells with mock, Nsp15 WT , Nsp15 H234A , and Nsp15 N277A rSARS-CoV-2 infection for 8 and 24 h (MOI of 5). Total RNA with poly(A) enrichment followed by RNA sequencing analysis. (A) Schematic of bulk RNA-seq experimental design (n = 3 per group). (B) PCA of total normalized transcript abundance from mock, Nsp15 wild-type and mutant rSARS-CoV-2 infection. Sparse PCA depicts the global transcriptome of individual sample. (C) Venn diagram for unique and shared differentially expressed genes (Padj < 0.05 & |log2FC| > 1) in cells infected with Nsp15 H234A and Nsp15 N277A mutants compared to Nsp15 WT virus. (D) Volcano plots showing GSEA results generated using MSigDB Hallmark pathways. (E) Cluster heatmap of GSVA scores generated using representative innate immune and metabolic signatures from MSigDB Gene Ontology signatures. (F) Expression heatmap of representative innate immune and metabolic genes in across mock, wild-type, and mutant rSARS-CoV-2 infection.
Article Snippet: BHK-21-hACE2 cell, a derivative of BHK-21 cell (ATCC, CCL-10), was established by transduction of lentiviral particle bearing
Techniques: Infection, RNA Sequencing, Mutagenesis, Virus, Generated, Expressing

Journal: bioRxiv
Article Title: SARS-CoV-2 Nsp15 antagonizes the cGAS-STING-mediated antiviral innate immune responses
doi: 10.1101/2024.09.05.611469
Figure Lengend Snippet: (A and B) Endogenous cGAS and STING mRNA levels in A549-ACE2 cells uninfected or infected with Nsp15 WT and Nsp15 H234A rSARS-CoV-2 at MOI of 5 for 8 or 24 h. RT-qPCR results are presented relative to the expression of 18S rRNA. Data are mean ± SD (n = 3) and analyzed by two-way ANOVA with Tukey’s multiple comparison test. * P ≤0.05; **** P ≤0.0001; ns, not significant. (C) BHK-ACE2 cells were mock infected or infected with Nsp15 WT and Nsp15 H234A rSARS-CoV-2 at MOI of 0.1, further transfected with cGAS and STING plasmids at 4 hpi. At 24 and 48 hpi, cell lysates were harvested for clarifying the indicated protein levels.
Article Snippet: BHK-21-hACE2 cell, a derivative of BHK-21 cell (ATCC, CCL-10), was established by transduction of lentiviral particle bearing
Techniques: Infection, Quantitative RT-PCR, Expressing, Comparison, Transfection
Journal: bioRxiv
Article Title: SARS-CoV-2 Nsp15 antagonizes the cGAS-STING-mediated antiviral innate immune responses
doi: 10.1101/2024.09.05.611469
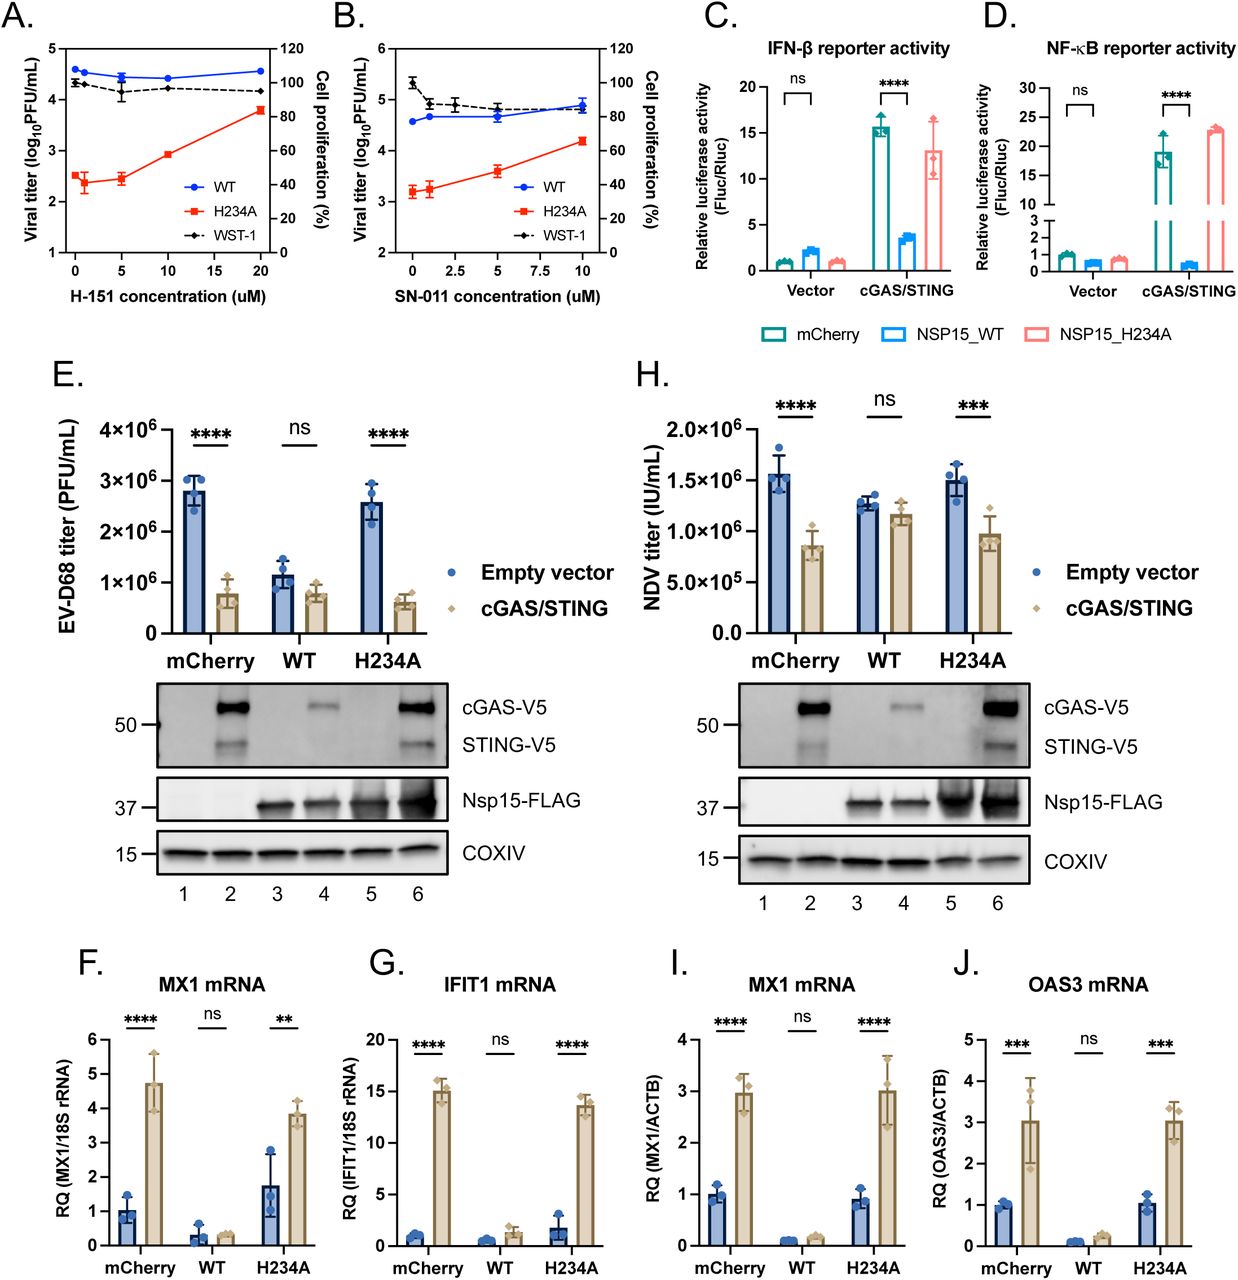
Figure Lengend Snippet: (A and B) A549-ACE2 cells were pretreated with H-151 or SN-011 for 16 h prior to viral infection. Cells were then infected with Nsp15 WT (blue line) and Nsp15 H234A (red line) rSARS-CoV-2 at MOI of 1 under H-151 or SN-011 treatment for 48 h. Supernatants harvested for viral titration by plaque assay. Cell viability determined by WST-1 assay after incubating with H-151 or SN-011 for 72 h (black dot line). Data are mean ± SD (n = 3). (C and D) HEK293T cells were co-transfected with IFN-β promoter reporter plasmid (C) or NF-κB responsive element reporter plasmid (D), Renilla control plasmid plus the indicated plasmids containing empty vector, cGAS/STING, mCherry and WT and H234A Nsp15 for 48 h. Relative luciferase activity was performed by use of Dual-Glo Luciferase System. Data are mean ± SD (n = 3) and analyzed by two-way ANOVA with Dunnett’s multiple comparison test. (E, F, G) HEK293T transfected with different combinations of plasmids were infected with EV-D68 at MOI of 0.1 for 48 h. Culture supernatants applied for viral titer quantification by plaque assay (E, upper bar graph). Cell lysates collected for protein level determination (E, lower blot graph) and total RNA collected for RT-qPCR (F, G). (H, I, J) HEK293T transfected with different combinations of plasmids were infected with NDV-EGFP at MOI of 1 for 48 h. Culture supernatants applied for viral titer quantification by focus forming assay targeting EGFP (H, upper bar graph). Cell lysates collected for protein level determination (H, lower blot graph) and total RNA collected for RT-qPCR (I, J). Relative target RNA level normalized with that of 18S rRNA or ACTB was shown. Data are mean ± SD (n = 3 or 4). and analyzed by two-way ANOVA with Šídák multiple comparison test. ** P ≤0.01; *** P ≤0.001; **** P ≤0.0001; ns, not significant.
Article Snippet: BHK-21-hACE2 cell, a derivative of BHK-21 cell (ATCC, CCL-10), was established by transduction of lentiviral particle bearing
Techniques: Infection, Titration, Plaque Assay, WST-1 Assay, Transfection, Plasmid Preparation, Control, Luciferase, Activity Assay, Comparison, Quantitative RT-PCR, Focus Forming Assay
Journal: International Journal of Molecular Sciences
Article Title: Mulberry Component Kuwanon C Exerts Potent Therapeutic Efficacy In Vitro against COVID-19 by Blocking the SARS-CoV-2 Spike S1 RBD:ACE2 Receptor Interaction
doi: 10.3390/ijms232012516
Figure Lengend Snippet: The inhibition of the interaction between the spike protein S1 receptor-binding domain (RBD) and the human angiotensin-converting enzyme 2 (ACE2) receptor by kuwanon C (KC). Spike protein coated on a 96-well plate interacted with a preincubated mixture of the ACE2 receptor and ( A ) anti-SARS-CoV-2 spike S1 antibody as the positive control and ( B ) 0, 3.125, 6.25, 12.5, 25, 50, or 100 μM KC. The inhibition of the spike S1 RBD:ACE2 receptor interaction by KC was determined based on chemiluminescence measurements.
Article Snippet: The
Techniques: Inhibition, Binding Assay, Positive Control

Journal: International Journal of Molecular Sciences
Article Title: Mulberry Component Kuwanon C Exerts Potent Therapeutic Efficacy In Vitro against COVID-19 by Blocking the SARS-CoV-2 Spike S1 RBD:ACE2 Receptor Interaction
doi: 10.3390/ijms232012516
Figure Lengend Snippet: The global kinetic analysis of KC binding to biotinylated ( A ) spike S1 RBD- and ( B ) ACE2 receptor-immobilized BLI sensors. The kinetics for the binding of KC to the spike S1 RBD or the ACE2 receptor were measured by the association of 0, 50, 200, and 400 μM of KC in PBS containing 1% DMSO with immobilized spike S1 or ACE2 receptor and the subsequent dissociation in PBS containing 1% DMSO.
Article Snippet: The
Techniques: Binding Assay

Journal: International Journal of Molecular Sciences
Article Title: Mulberry Component Kuwanon C Exerts Potent Therapeutic Efficacy In Vitro against COVID-19 by Blocking the SARS-CoV-2 Spike S1 RBD:ACE2 Receptor Interaction
doi: 10.3390/ijms232012516
Figure Lengend Snippet: The binding kinetics of KC to spike S1 RBD and ACE2 receptor.
Article Snippet: The
Techniques: Binding Assay

Journal: International Journal of Molecular Sciences
Article Title: Mulberry Component Kuwanon C Exerts Potent Therapeutic Efficacy In Vitro against COVID-19 by Blocking the SARS-CoV-2 Spike S1 RBD:ACE2 Receptor Interaction
doi: 10.3390/ijms232012516
Figure Lengend Snippet: In silico docking simulation between KC and the spike protein/ACE2 receptor. KC was docked onto the SARS-CoV-2 spike protein and ACE2 receptor (PDB code: 6M0J) using AutoDock Vina. The pharmacophore of KC with each target proteins was analyzed using BIOVIA Discovery Studio Visualizer.
Article Snippet: The
Techniques: In Silico

Journal: International Journal of Molecular Sciences
Article Title: Mulberry Component Kuwanon C Exerts Potent Therapeutic Efficacy In Vitro against COVID-19 by Blocking the SARS-CoV-2 Spike S1 RBD:ACE2 Receptor Interaction
doi: 10.3390/ijms232012516
Figure Lengend Snippet: KC inhibits SARS-CoV-2 lentiviral pseudovirus infection in HEK293T cells stably expressing human ACE2 and TMPRSS2. ( A ) The cytotoxic effect of KC in HEK293T cells stably expressing human ACE2 and TMPRSS2 was determined using the MTT assay. HEK293T cells were cultured in 96-well plates (5 × 10 4 cells/well) for 18 h. ( B ) The ACE2 expression level in HEK293T cells was monitored during KC treatment using real-time quantitative PCR analysis. Then, WT or mutant (D614G) SARS-CoV-2 spike pseudovirus (at a final concentration of 1 × 10 4 TU/mL to each well) were mixed with different concentrations of KC (2 and 20 μM) or anti-SARS-CoV-2 antibody, and the mixtures were incubated at 37 °C for 1 h. Then, these mixtures were added to HEK293T cells. ( C , D ) Green fluorescent protein (GFP) expression levels using flow cytometry were assessed at 72 h after viral infection, scale bar = 100 μm. ( E , F ) The inhibitory effect of SARS-CoV-2 spike pseudovirus infection was determined by measuring GFP expression using flow cytometry and measured under a fluorescence microscope. Bar graph (mean ± SEM) statistics were determined from three experimental data sets using one-way ANOVA with Tukey’s post hoc test, *** p < 0.001, compared with the CON (KC-untreated) samples. ### p < 0.001, compared with the cell-only sample.
Article Snippet: The
Techniques: Infection, Stable Transfection, Expressing, MTT Assay, Cell Culture, Real-time Polymerase Chain Reaction, Mutagenesis, Concentration Assay, Incubation, Flow Cytometry, Fluorescence, Microscopy

Journal: International Journal of Molecular Sciences
Article Title: Mulberry Component Kuwanon C Exerts Potent Therapeutic Efficacy In Vitro against COVID-19 by Blocking the SARS-CoV-2 Spike S1 RBD:ACE2 Receptor Interaction
doi: 10.3390/ijms232012516
Figure Lengend Snippet: KC suppresses the infection of a clinical isolate of SARS-CoV-2 alpha strain (βCoV/Korea/KCDC03/2020) in Vero cells. Vero cells were cultured on 384-well plates (1.2 × 10 4 cells/well) for 24 h. Then, Vero cells were infected with SARS-CoV-2 (MOI 0.0125) immediately after being treated with serially diluted KC and incubated at 37 °C for 24 h. The cells were then stained using anti-SARS-CoV-2 nucleocapsid (N) primary antibody, Alexa Fluor 488-conjugated goat antirabbit IgG secondary antibody, and Hoechst 33342.
Article Snippet: The
Techniques: Infection, Cell Culture, Incubation, Staining

Journal: International Journal of Molecular Sciences
Article Title: Mulberry Component Kuwanon C Exerts Potent Therapeutic Efficacy In Vitro against COVID-19 by Blocking the SARS-CoV-2 Spike S1 RBD:ACE2 Receptor Interaction
doi: 10.3390/ijms232012516
Figure Lengend Snippet: Schematic of the blockade of the SARS-CoV-2 spike S1 RBD:ACE2 receptor interaction by KC.
Article Snippet: The
Techniques: